·
2 minute read
·
2 minute read
Humans are visual creatures. We tend to engage more with pictures and videos than we do with text.
According to the Social Science Research Network, 65% of the population are visual learners, so they prefer to see what they are learning rather than just listening or through role-playing exercises. This is just one reason why data visualisation is important for your organisation.

What is Data Visualisation?
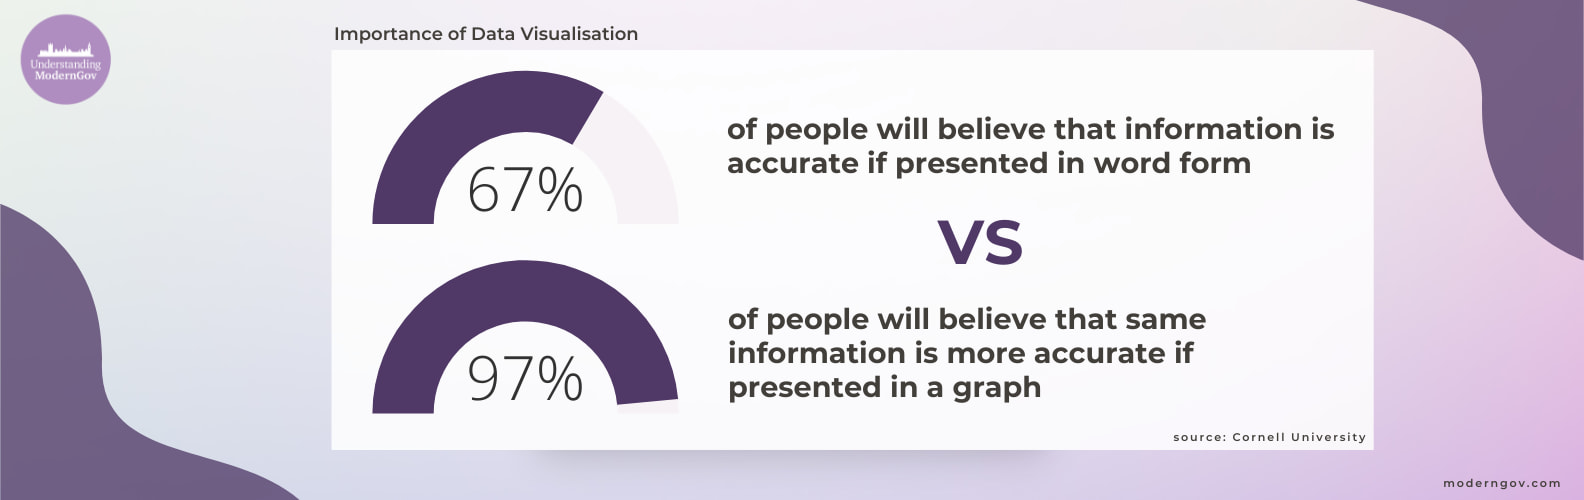
It can be defined as the methods used to represent data as visual objects contained in graphics. These visual infographics, including charts, graphs and maps help identify key trends, patterns and relationships in data. Data visualisation can be an extremely powerful tool for organisations to transform and visualise data to tell a story both internally and externally.
The vast amounts of data that we produce and consume can be overwhelming. Domo’s ‘Data Never Sleeps’ report estimates that we produce a staggering 2.5 quintillion bytes of data every day and this number is expected to continue to grow. Knowing how to sift through this mass of data and select the relevant components to present is an essential skill for effective data visualisation.
%20compressed.jpg?width=1584&height=500&name=1%20(2)%20compressed.jpg)
Three Reasons Why Data Visualisation is Important for Your Organisation
- Visuals get everyone on the same page
As mentioned beforehand, visual learning is the most popular form of absorbing new information. With visual design components enabling your data to look more appealing, people are more likely to retain the information you are presenting - whether you’re using it in the boardroom or putting together an infographic for your website.
Learn more about using data to tell a story in the public sector.
- Spot the difference
Being able to visualise your data clearly through charts, graphs and maps can enable you to pick out emerging trends or patterns in your customer’s behaviour. This is much easier than spending your time on a complicated and hard-to-read Excel spreadsheet that not many will understand.
- Snappy decision making
With a clear and easy-to-understand visual representation of data, key decision-makers can make better-informed data-driven decisions quickly using proven and accurate statistics. Although some decisions can't just be made with numbers, presenting and using data in a clear format can back up any points or analysis you wish to make.
From an organisational point of view, these reasons are not only important but incredibly beneficial. In a wider context, understanding your data means that you understand your audience – a factor that’s crucial for any public sector organisation.
%20compressed-1.jpg?width=1584&height=500&name=2%20(1)%20compressed-1.jpg)
Different Types of Data
Data can be confusing, but once you understand the three main types, you're good to go...
- Categorical
Qualitative or categorical data exemplify types of data which are divided into groups. Examples of these variables include age group, sex, race or educational level.
- Numeric
Numerical data is associated with data that is measurable. It can be classified into two groups, including discrete data, which represents items that can be counted, and continuous data, which identifies as measurements. Examples of numeric data include a person’s height, weight or blood pressure.
- Time-based
Time-based data or a ‘time series’ is a sequence of data points taken continuously at equally spaced points in time. This type of data set is used to measure change and predict how something may change in the future. Examples can include performance monitoring, network data or trades in a market.
Learn How You Can Benefit your Organisation Using Data
Want to learn more about the key principles of data visualisation? Or how to master statistical analysis? We've got a range of courses that will help you use data to get ahead. See our upcoming Analytics training courses and secure your place.